In 2023, the global claw machine market has exceeded 18 billion US dollars and continues to expand at a compound annual growth rate of 11.2%. From the co-branded IP limited editions on the streets of Japan to the golden prize-grabbing machines sought after by the rich in the Middle East, this seemingly "childish" game is evolving into a commercial carnival of technology, data and human nature.
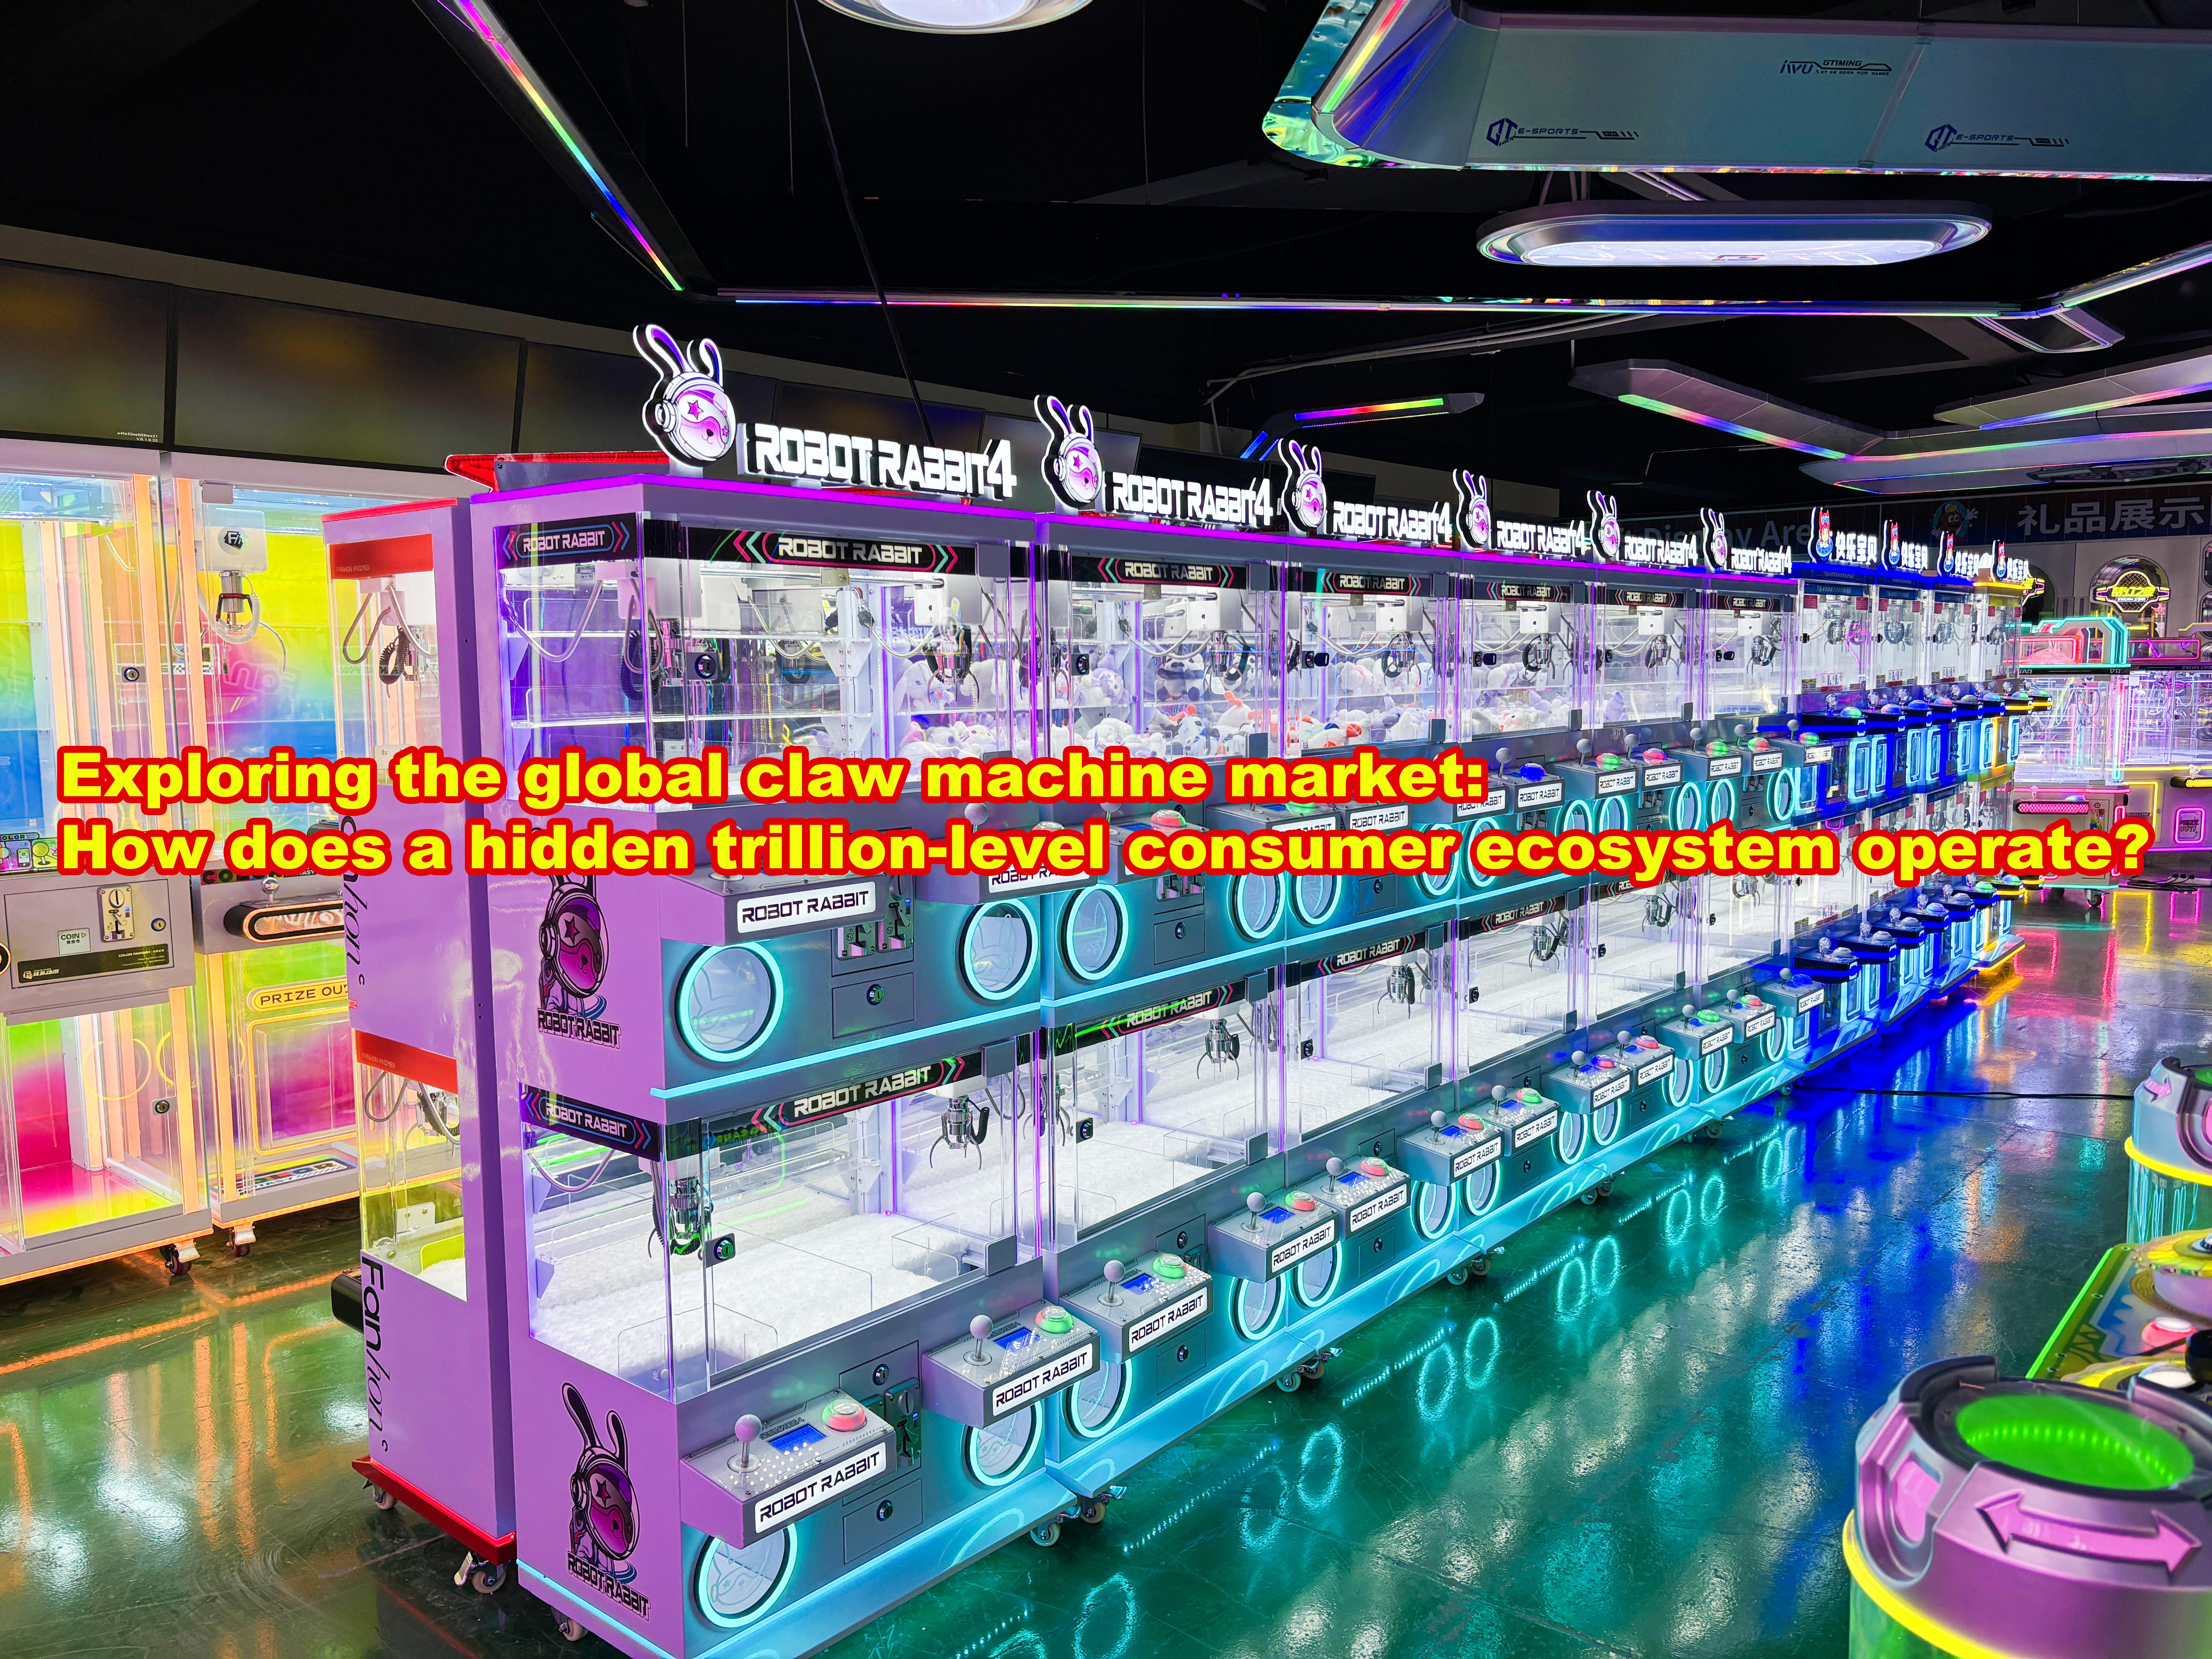
1. Breaking down prejudice: claw machines are not "outdated toys"Contrast:
Sega Japan's financial report data: In 2023, the average monthly revenue of a single claw machine will reach US$260, exceeding traditional pinball machines (about US$190).
China's sinking market case: The sales per square meter of claw machines in county shopping malls is 4 times that of surrounding milk tea shops.
User portrait subversion:
Post-80s parents take their children to relive their childhood (nostalgic crowd) + Generation Z pays for "social check-ins" (fashion symbol) + couples date "low-cost heartbeat" (emotional value)
2. Scale decomposition: Three major driving forces of the global market1. Technology upgrade: Game design from "probability metaphysics" to "precision algorithm"
Dynamic difficulty adjustment: Sensors collect player stay time, number of failures, and calculate the best time to ship (for example: Microsoft XBOX laboratory cooperation project).
Payment innovation: "Face scanning to exchange game coins" in the Southeast Asian market saves 70% of labor costs (the proportion of coin-operated devices in Singapore is less than 30%).
2. IP co-branding: from plush toys to upstream harvesting
Disney cooperation cost analysis: the licensing fee for a "Frozen" theme machine is 6 times that of ordinary models, but the number of coins inserted by users at a time has increased by 300%.
Japan Bandai model: limited edition Gundam models are only available in claw machines, and the premium in the second-hand market has triggered hunger marketing.
3. Data infrastructure: how offline traffic is "controlled by the cloud"
Chinese player case: a chain brand monitors national machine data through IoT devices and finds that revenue soars when "the shipment rate of pink dolls increases by 5% at 7 pm on Friday."
Advertising revenue sharing model: "Scan the code to grab the doll and get free beauty samples" appears in Korean business circles, and the brand pays according to the drainage effect.
3. Undercurrents: Emerging markets and risk warningsMiddle East opportunities: UAE shopping malls introduce "golden prize grabbing machines", grab jewelry for $50 per time, and the gross profit margin reaches 80%.
Policy minefields: Many European countries define "adjusting the difficulty percentage" as gambling equipment and require operators to apply for special licenses.
Data Toolbox
Global market size: about US$18 billion in 2023 (Grand View Research data), with a compound growth rate of 11.2% from 2024 to 2030.
Regional concentration: Asia accounts for 67% (mainly Japan + China), North America only 14% but the ARPU value (user single consumption) is 30% higher.
Cost structure example: In the average monthly cost of an ordinary model, the site share accounts for 45%, replenishment 20%, operation and maintenance 15%, and net profit is about 20%.
Multiple choice question: In the context of soaring mall rents, you are more willing to bet on -A. Develop "shared claw machines" (users use mobile phones for remote control, mail prizes, and compete for offline coverage)
B. Transform into "grabbing dolls metaverse" (VR + physical exchange, betting on the entry of Generation Z)
C. Deepen "grabbing dolls +" (blind boxes, beauty products, fresh food are placed in the machine, and everything can be grabbed)


